
Annex Bulletin 2008-10 April 25, 2008
A partially OPEN CLIENT edition
Big Blue Takes Chill Off Wall Street's Spring (Analysis of IBM's first quarter business results)
Just Say NO to Greed - Killer of Dreams! (An editorial comment about subprime financial crisis)
INDUSTRY TRENDS
Updated 4/25/08, 11:30AM PDT
Analysis of Top 20 IT Companies' Market & Business Performances
IBM "Places" By a Nose over Google
Microsoft Still Tops in Market Cap But Its Lead Narrows
SCOTTSDALE, Apr 25 – "Win, place or
show" are the three money positions in the game of horse racing. In
our semi-annual "Annex Top 20 IT Companies Stakes," the winner was the
odds-on favorite - Microsoft. Its market cap of $295 billion was up
only 0.7% since a year ago, but it was still enough for a comfortable "win"
over the "place" and "show" finishers in this category.
Perhaps the biggest surprise, however, was the second "place" finish in the market cap race. IBM beat Google "by a nose" ($172.54 billion vs. $172.37 billion - see the chart), reversing the finish in the October market cap stakes, when Google edged out Big Blue by a similar margin. IBM's market cap is up 17.9% since April a year ago, Google's 17.8%. So it doesn't get much closer than that. But since IBM was a laggard stock a year ago, while Google had the momentum on its side, the latest results mean that those who bet on IBM would have received a greater payback at the betting window.
MARKET Rankings of Annex Top 20 IT
Contrary to the perceived "gloom and doom" in the stock
market and the U.S. general economy these days, the Annex Top 20 IT
companies' market cap is up 11% since a year ago to $1.42 trillion.
And its fundamentals are even better. The Annex Top 20 IT earnings
were up 30% to $624 billion in the last 12 months, while their revenues
surged by 16% in the same time period (see below). So "up, up, and
away" seems to be the message from the top of the IT industry pyramid.
But averages can be misleading. Remember that statistician who drowned trying to cross a lake with an average depth of three feet? Well, "the well of plenty" is not very deep atop the IT industry. Losers outnumbered the winners in the last 12 months when it comes to market cap changes (see the chart). Which suggests a budding plutocracy among the Annex Top 20 IT in the industry, where the old adage, "the rich get richer and the poor get poorer," seems to apply.
And "an Apple a day keeps doctors away" is still the rule here. Apple's market cap change is by far the most impressive among the leading IT industry competitors. Oracle, Intel, IBM, Google and EMC are the next four competitors and the only ones, besides Apple, whose market cap increased in double digits in the last 12 months.
The biggest laggards in this Annex Top 20 IT category and Lexmark, Dell, EDS and Sun Micro.
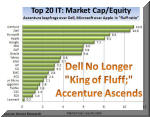
Market cap/equity.
Dell is no longer the "King of Fluff," having just surrendered
that dubious title to Accenture. When it comes to market cap/equity
ratio, the market indicator that we dubbed the "fluff ratio" back in 1998, when we first voiced our
criticism of the stock buybacks (see "Cabbage
Patch Dolls...," Nov 1998), Dell has sat on that throne for 10
years now as it has been a company that has always believed in returning the
wealth to investors rather than keeping it on its books. So it has a
tiny
 equity
relative to its market cap (for a 10.6 ratio).
Ditto re. Accenture (10.9), a relative newcomer to publicly traded companies, having gone public in 2001. Thus its equity is relatively small. But Accenture's market cap has gained 5% wince a year ago, whereas Dell's has dropped 30%, thus causing a change at the top of the "fluff ratio" rankings.
Microsoft, which placed third (8.6), has a slight lead on Apple (8.1). And both of them have a substantial lead on Apple, Google, IBM, SAP and Oracle, placed 4-8 in our "fluff ratio" rankings.
P/E Ratio.
When it comes to P/E ratios, the stock market indicators of what
investors thing the future holds for a company's revenue and earnings
performance, Yahoo is by far ahead of the rest of the Annex Top 20 IT pack
(with a P/E of 58). Microsoft's bid and takeover battle are, of
course, the principal reason for it. Because the Yahoo earnings per share
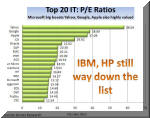 are
down 2% since a year ago, and revenue is up only 8%, while its market cap is
down 11% despite the boost from Microsoft.
Google and Apple are second and third in this category with P/E ratios of 39 and 37 respectively, followed by CA, Oracle, SAP and EMC, each with a P/E of 20 or higher.
At the other end of the scale, CSC, Fujitsu, Dell and EDS are the least appreciated companies among the Annex Top 20 IT in this respect.
BUSINESS Rankings of Annex Top 20 IT
Net Earnings.
Microsoft, the IT industry's top bottom line for years,
continues to tower over the much bigger companies (in terms of revenues) that trail it
at the bottom line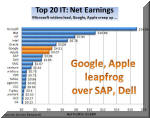 ,
such as IBM or HP. In fact, the industry's most profitable company,
with about $17 billion net earnings, up 31% from a year ago, has widened
its lead over its major competitors (IBM, HP, Intel - up 19%, 25% and 13%
respectively) in the last 12 months.
Nor are these five companies alone in experiencing an earnings boom. All but four of the Annex Top 20 IT competitors have seen their earnings grow in the last 12 months (see the charts). Gloom and doom? Not within this elite group. An IT "Boom Club" would be a more appropriate name.
As to the laggards, the usual suspects ACS, Lexmark and Fujitsu are surprisingly joined by Yahoo at the bottom of this scale. Microsoft shareholders should hope that its management know something we don't when making such an aggressive bid for Yahoo. As for the Yahoo management, the fact that they could not find a "knight in shining armor" to save them from the Redmond, WA juggernaut speaks volumes about their precarious position in the marketplace.
Revenues.
A year and a half ago, HP became the first company in the IT
industry to surpass the $100 billion revenue mark. IBM did it last
year, leaving a $40 billi on-gap
between the two frontrunners and the third largest company in the industry -
Dell.
But just how little size matters when it comes to market valuations one can see from the preceding analysis of the stock market trends. Dell, an erstwhile high-flyer and Wall Street darling, is in the cellar in most market categories. Which goes to show us how fickle investors can be.
At the o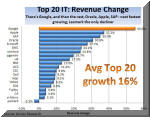 ther
end of the scale, Lexmark, ACS and Yahoo are the only companies among the
Annex Top 20 IT whose revenues are now under $10 billion. Which is a
pretty good indicator of how rapidly the industry has grown in the last
decade or so.
As group, the Annex Top 20 IT grew by 16% in the last year. The industry's pole position continues to belong to Google. But Apple, SAP Oracle, and even Microsoft all reported impressive growth rates during the last 12months, at close to or above 30%.
Equity.
When it comes to equity, you'd think that the industry's oldest
company that has been accumulating profits for over 90 years would have the
biggest pot. Think again. IBM is only fourth. But that's a
good news. A good news? Yes. Becaus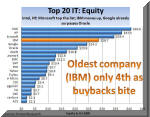 e
IBM was in the sixth position in the last equity stakes race. Thanks
to its excellent profit performance in the last several quarters, coupled
with lower stock repurchases, its equity has grown more rapidly than that of
some of its close competitors (Google, Oracle, for example, that were ahead
of IBM the last time around).
At the other and of the equity scale, we once again have ACS, Accenture, Dell and CA bringing up the rear.
Summary
Gloom and doom? Not atop the IT sector. So for investors who are looking to get a piece of the companies that know how to make money at a time of economic uncertainty, the top of the IT industry, as epitomized by Annex Top 20 IT firms, is not a bad place to be.
Of course, that's if common sense and logic were used when making investments. As we have seen so many times in the past, that's often a losing proposition. So maybe flipping the charts upside down would do the trick and get the point across to Wall Street? :-)
|
Annex Clients: CLICK HERE for detailed table of the Top 20 IT Cos. |
Happy bargain hunting!
Bob Djurdjevic
![]() Click
here for PDF (print) version
Click
here for PDF (print) version
![]()
For additional Annex Research reports, check out... Annex Bulletin Index 2008 (including all prior years' indexes)
![]()
Or just click on SEARCH and use "company or topic name" keywords.
Volume XXIII, Annex
Bulletin 2008-10 Bob Djurdjevic, Editor 8183 E Mountain Spring Rd, Scottsdale, Arizona 85255 (c) Copyright
2008 by Annex Research, Inc. All rights reserved. |
Home | Headlines | Annex Bulletins | Index 1993-2008 | Special Reports | About Founder | Search | Feedback | Clips | Activism | Client quotes | Speeches | Columns | Subscribe
![]()
The z10 Lifts "Big Green" (Analysis of IBM's new mainframe announcement)
HP Beats the Street Again (Analysis of HP's 1Q08 business results)
Capgemini's Great Valentine's Day Gift (Analysis of Capgemini's 4Q07 and FY07 results)
Profit Drops, Stock Follows (Analysis of EDS's 4Q07 results)
Profit, Revenue Surge, Lifting Stock, Too (Analysis of CSC's 3Q08 results)
Services, Emerging Markets Boost IBM (Analysis of IBM's full 4Q07 results)
Big Blue Shines in 4Q (Analysis of IBM's preliminary 4Q07 results)
Microsoft Still Wall Street Darling (Analysis of institutional holdings of Top 10 IT Cos)